Walla allows you to draw different shapes based on data from Excel. The shapes can be redrawn in seconds when data in Excel changes. There are four basic shapes currently supported which includes circle, rectangle, regular polygon and irregular polygon. You can create various plots using the four basic shapes. Every project in Walla is associated with a specific worksheet in a spreadsheet. In your spreadsheet, you can define the input parameters and calculate all the shape data that will be passed to Walla based on the input parameters. Once the project is set up, you can change your plots at any time by changing the input parameters in the spreadsheet. Besides, section properties like area, centroid and moment of inertia etc. can be calculated.
View software licensing detail
Download files for example in the Video
Request 30-day trial
Windows Operating System Supported
Windows XP, Windows Vista, Windows 7
Prerequisites
- Microsoft .Net Framework 2.0 or above
- Microsoft Access Database Engine 2010 Redistributable (already included in the installation file) or you can download from Microsoft website.)
Description of Menu Items
Figure 1 shows the user interface of Walla. Each menu item is described below.
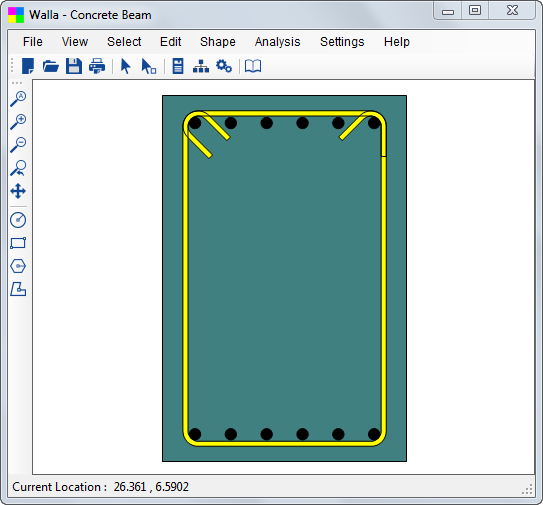
Figure 1 Walla User Interface
File–˃New
Start a new project
File–˃Open
Open an existing project
File–˃Save
Save current project when it is already associated with a file path. Otherwise, it prompts you to enter a file path.
File–˃Save As
Save current project to a different file path
File–˃To Clipboard
Take a screenshot of plot and put in the windows clipboard
File–˃Exit
Close the program.
View–˃Zoom All
Zoom all the objects to fit window size
View–˃Zoom In
Zoom in objects
View–˃Zoom Out
Zoom out objects
View–˃Reset View
Reset the view to original zoom level
View–˃Pan
Move current view
Select–˃Click/Window
Select objects by either clicking on objects or drawing a window
Select–˃All
Select all the objects
Edit–˃Bring to Front
Bring selected objects to front layer
Edit–˃Send to Back
Send selected objects to back layer
Edit–˃Delete
Delete objects selected
Edit–˃Property
Display the shape definition dialog
Edit–˃Manage Shapes
The shapes manager allows you to modify or delete the shapes already defined. You can operate on only one shape at a time.
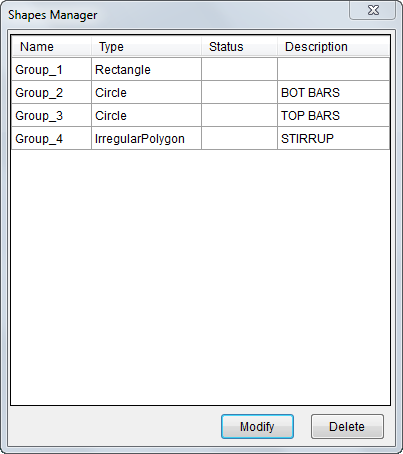
Figure 2 Manage Shapes Dialog
Edit–˃Update
Update the plot when data in Excel changes
Shape–˃Circle
A circle is defined by three parameters: circle center X coordinate, circle center Y coordinate and circle diameter. Figure 3 shows an example of data required to draw two circles. You should input E12:G13 for the cell range on Figure 4. If there is any error on a row of data, circle corresponding to that row won’t be drawn until the data gets updated to correct values.
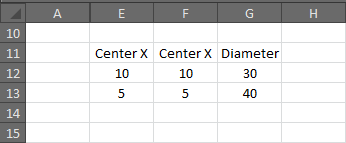
Figure 3 Circle Data Format
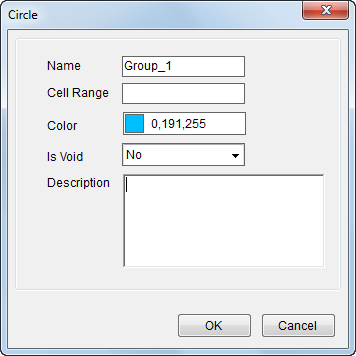
Figure 4 Circle Definition Dialog (other shapes similar)
Shape–˃Rectangle
A rectangle is defined by five parameters: rectangle center X coordinate, rectangle center Y coordinate, width, height and rotation. Rotation is defined as the rotation of rectangle around its center. Positive value corresponds to counterclockwise rotation. Unit of rotation is degree. Figure 5 shows an example of data required to draw two rectangles. You should input E19:I20 for cell range input. If there is any error on a row of data, rectangle corresponding to that row won’t be drawn until the data gets updated to correct values.
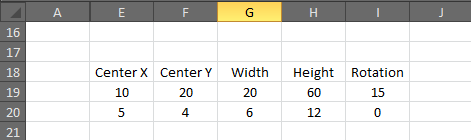
Figure 5 Rectangle Data Format
Shape–˃Regular Polygon
A regular polygon is defined by six parameters: polygon center X coordinate, polygon center Y coordinate, number of sides, circle type, radius and rotation. Circle type should be either 0 or 1. 0 means the regular polygon is defined using its circumscribed circle while 1 means it is defined using its inscribed circle. Radius defines the radius of circumscribed or inscribed circle. Rotation is defined as the rotation of polygon around its center. Positive value corresponds to counterclockwise rotation. Unit of rotation is degree. Figure 6 shows an example of data required to draw five regular polygons in the spreadsheet. You should input E26:J29 for cell range input. If there is any error on a row of data, regular polygon corresponding to that row won’t be drawn until the data gets updated to correct values.
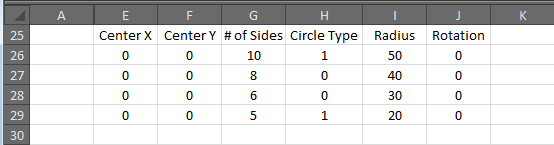
Figure 6 Regular Polygon Data Format
Shape–˃Irregular Polygon
An irregular polygon is defined by the vertex coordinates of the polygon and line information for each side of the polygon. Cell range input E33:J36 in Figure 7 plots an oblong shape as shown in Figure 8. First two columns of data define the vertices of polygon. Data in the rest four columns defines how the vertices are connected either by straight line or arc. Each row of data defines the line starting from vertex of current row to vertex of the next row. For line type, 0 stands for straight line and 1 stands for arc. The last three columns of data is only required for defining an arc. Sweep angle defines the angle arc sweeps through. The unit is degree. For sweep direction, 0 stands for counterclockwise direction and 1 stands for clockwise direction. For the small or large arc, 0 stands for small arc and 1 stands for large arc.
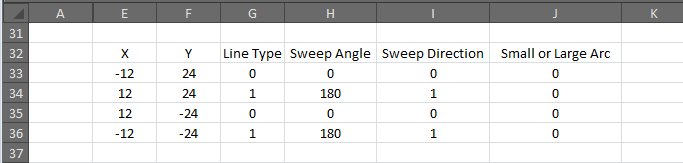
Figure 7 Irregular Polygon Data Format
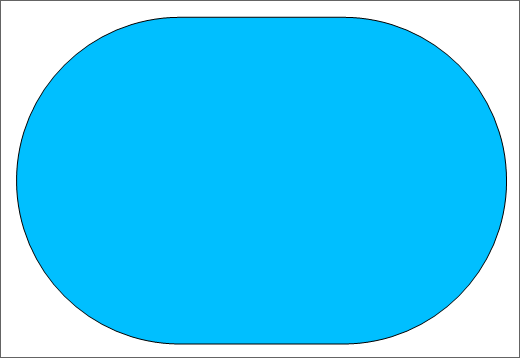
Figure 8 Oblong Shape
Analysis–˃Section Property
Calculate section property when shapes are not intersecting or self-intersecting.
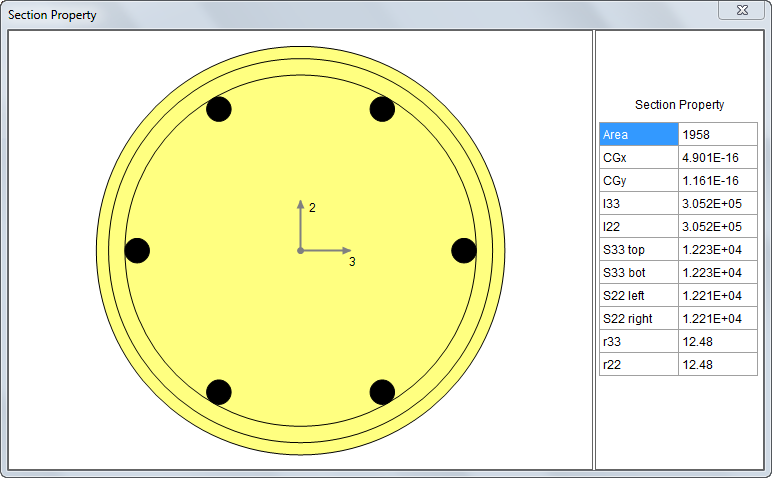
Figure 9 Section Property
Settings–˃Show Axis
Toggle x and y axis display
Settings–˃Excel Data Source
Specify the spreadsheet and worksheet that contains the data for shapes
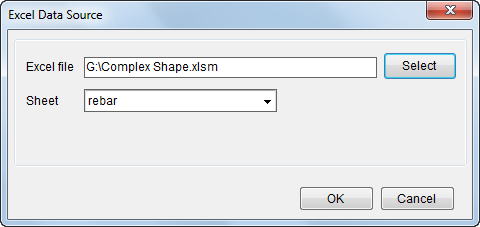
Figure 10 Excel Data Source Dialog
Settings–˃Open Folder Containing Current Excel File
Open the folder that contains Excel file associated with current project with the file highlighted
Help–˃Online Help
Open the online help
Help–˃About
Display license and version information about the program