The following example will show you how to use SE::Column to generate design interaction diagrams (biaxial bending Mx-My diagrams) for the Caltrans oblong column. This example is based on the column information from Caltrans Bridge Design Aids section 13 page 13-24. The document can be downloaded from here.
At the end, Mx-My interaction diagrams for different axial force Pn are plotted on a single chart to compare with chart published in Caltrans Bridge Design Aids.
Below is some column information which you can find from the document downloaded above.
Column section: 4’x6’
Clear cover: 2 inches
Concrete compressive strength: f’c=3.25 ksi
Longitudinal reinforcement: (30) #9
Steel modulus of elasticity: 29000ksi
Steel yield strength: 60ksi
Phi factor: use 1.0
Pn (positive value is compression):
-500k, 0, 500k,1000k,1500k,2000k,2500k,3000k,3500k
We use the Kip, in unit system by default.
Step 1
Draw a rectangle with Draw–˃Shape–˃Rectangle.
Make sure the properties of the shape look the same as shown in Figure 1.0.
Draw four bars at the vertex of the rectangle. The bars here are only used to mark the vertex location of the rectangle. It will be deleted later. Instead of doing this, you can set up the grid for drawing the rectangle in the next step.
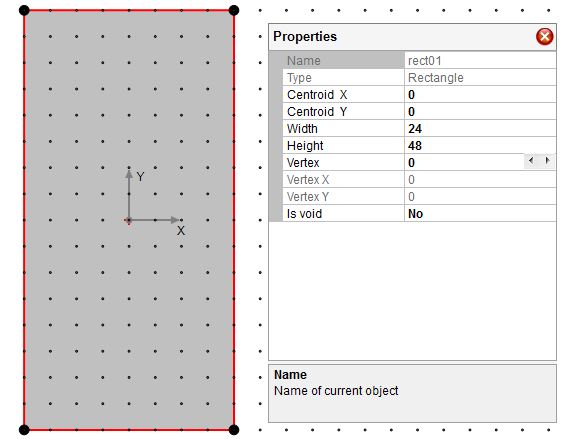
Figure 1.0 Step 1
Step 2
Delete the rectangle created in step 1 and redraw the rectangle with Draw–˃Shape–˃Irregular Polygon based on the vertex information from step 1.
Make sure the snap to point is on.
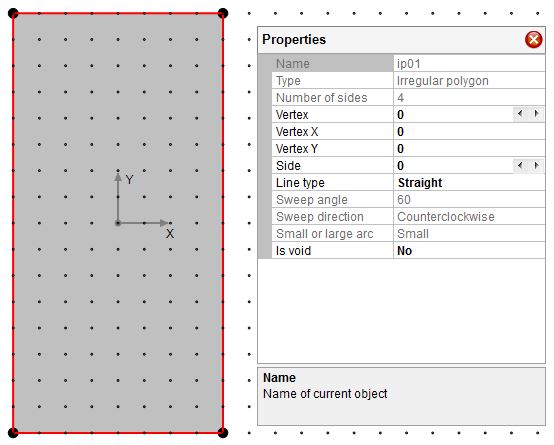
Figure 2.0 Step 2
Step 3
In the property grid, click on the triangle on Side until one of the long side of the rectangle is highlighted. Change the straight line to an arc based on the information shown in Figure 3.0.
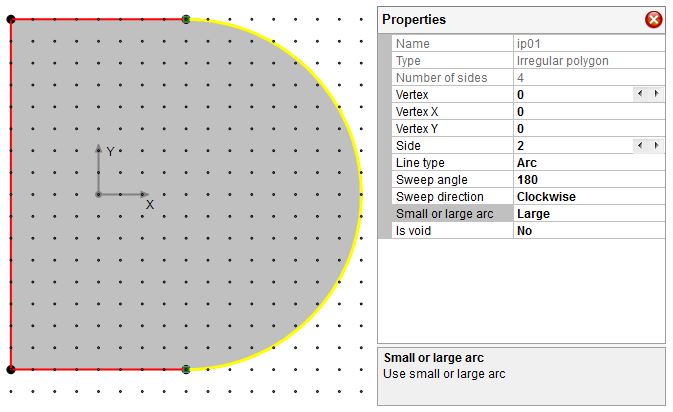
Figure 3.0 Step 3-1
Make the same change for the other side so that it will look like what is shown in Figure 3.1.
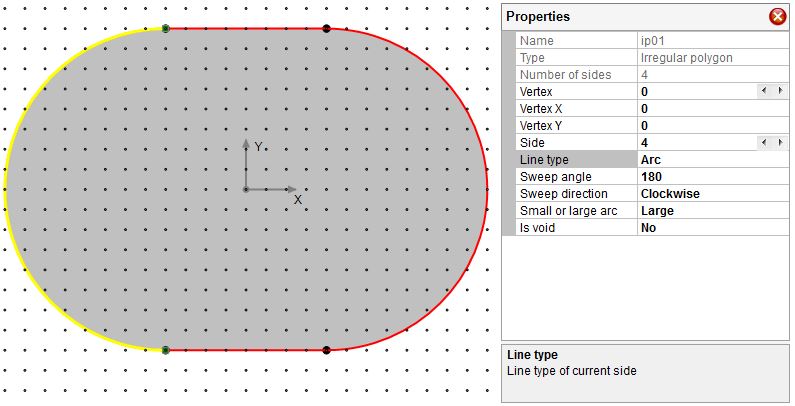
Figure 3.1 Step 3-2
Step 4
Draw strands with Draw–˃Reinforcement–˃Circular Pattern Bar. Make sure properties of the circular pattern bar look the same as shown in Figure 4.0.
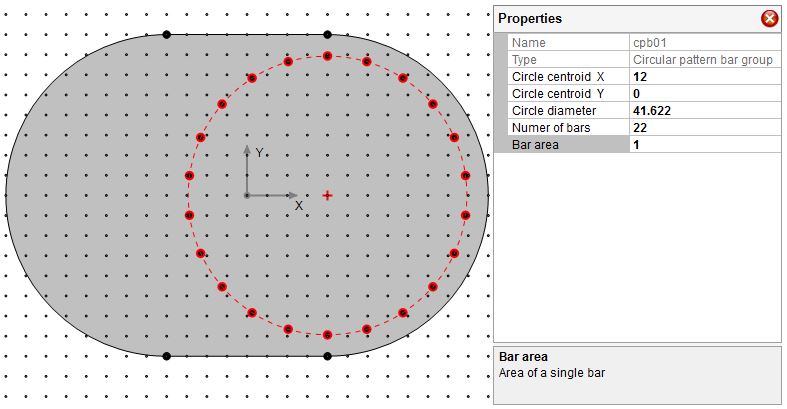
Figure 4.0 Step 4-1
Rotate the circular pattern group bar with Edit–˃Move for 8.18 degrees so that the rebar location will look exactly the same as shown in the document.
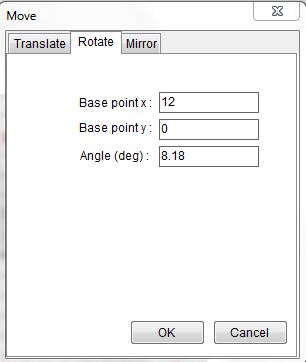
Figure 4.1 Step 4-2
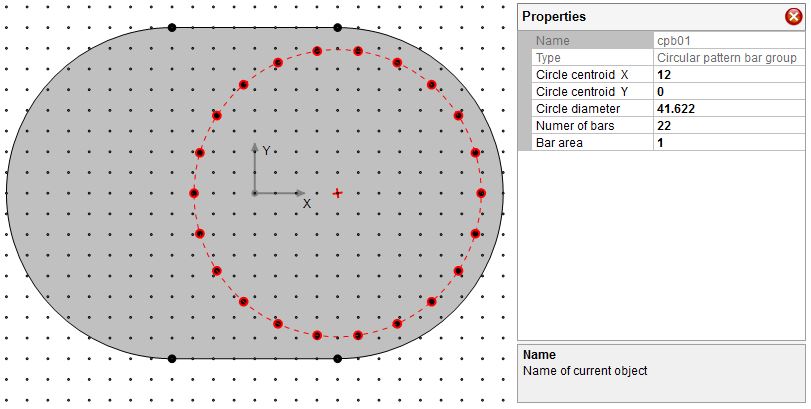
Figure 4.2 Step 4-3
Use Edit–˃Replicate to generate a mirror copy of current bar group.
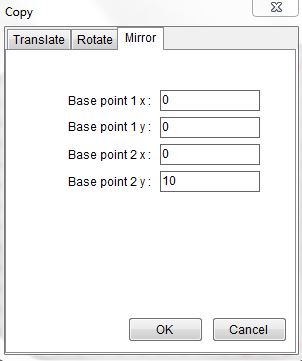
Figure 4.3 Step 4-4
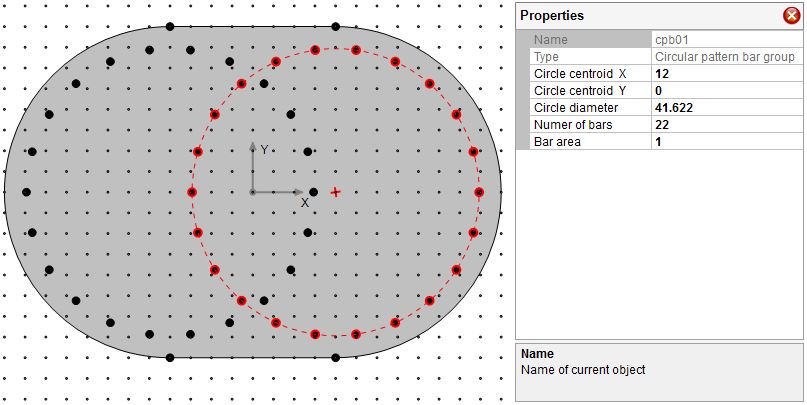
Figure 4.4 Step 4-5
Explode the group bars into single bars using Edit–˃Explode Group Bar. Delete the bars that are not needed and it should look like what shows in Figure 4.5.
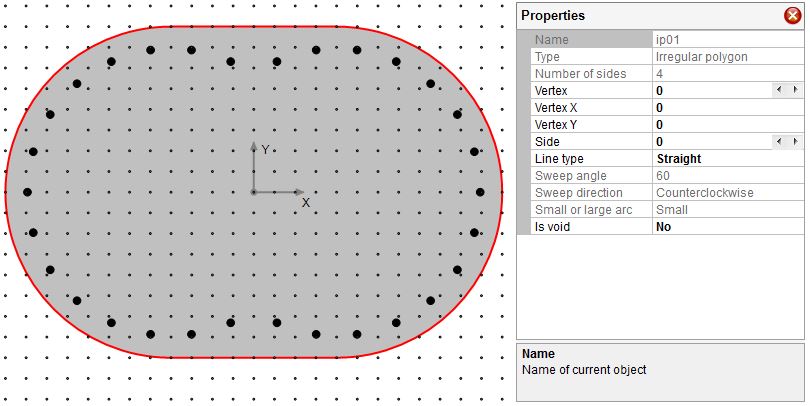
Figure 4.5 Step 4-6
Step 5
Select biaxial bending from Parameters–˃Criteria. Leave the design code as it is. We will revise the phi factors later.
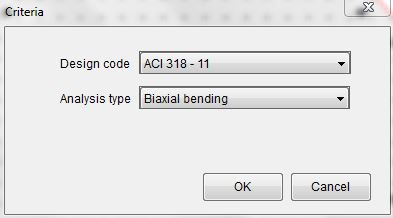
Figure 5.0 Step 5
Step 6
Input concrete compressive strength, reinforcing steel yield strength and steel modulus of elasticity using Parameters–˃Material. Leave the design code as it is. We will revise the phi factors later.
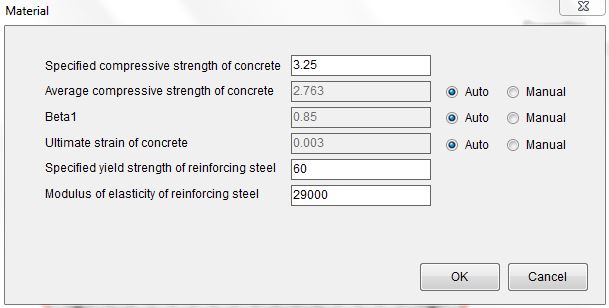
Figure 6.0 Step 6
Step 7
For this case, use 1.0 for all the resistance factors. This can be done using Parameters–˃Resistance Factors.
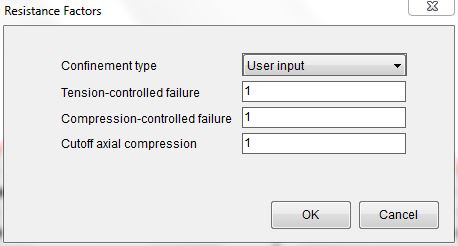
Figure 7.0 Step 7
Step 8
For this case, we will skip design loads input since we are only trying to generate interaction diagrams here. Run the analysis with Analysis–˃Run.
Step 9
Generate the Mx-My interaction diagram for each axial force using Analysis–˃View M-M Diagram. After the analysis is done, switch the unit system to Kip,ft.
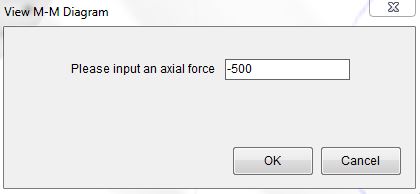
Figure 9.0 Step 9-1
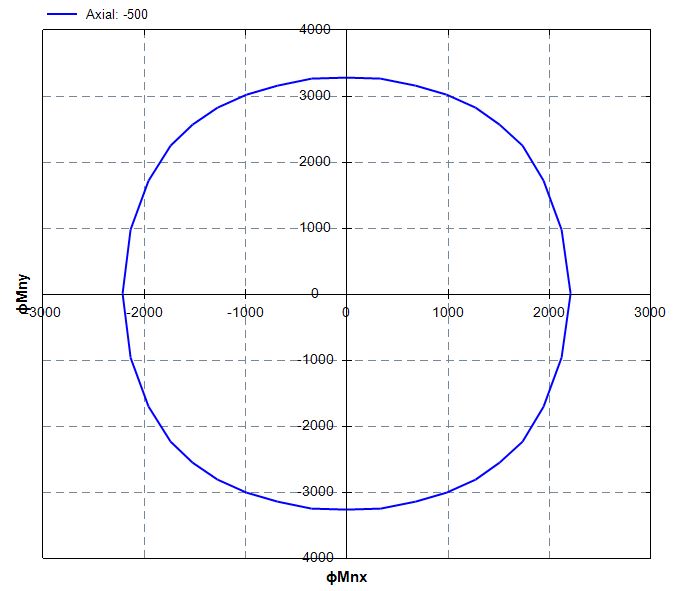
Figure 9.1 Step 9-2
Export the interaction diagram data by right clicking on the chart. Run the analysis for all other axial forces in the same way.
Step 10
Plot all the interaction diagrams with Excel on a single chart. For easier comparison with the chart published in the document, only the positive values are plotted (Only the upper right part of the diagram).
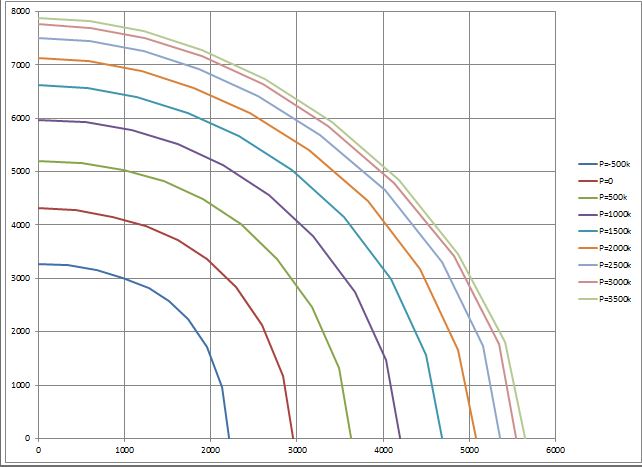
Figure 10.0 Step 10