The following example will show you how to use SE::Column to design a rectangular column.
Design code: ACI 318-05
Column dimension: 4 ft x 4 ft
Clear cover: 2 inches
Concrete compressive strength: 4 ksi
Reinforcing steel: 6 #14 each side fy = 60 ksi
Confinement type: Tie
Design load: P=1000 kips, Mx = 2000 k-ft, My =1000 k-ft
We use the Kip, in unit system by default.
Step 1
Draw a rectangle which represents the outline of column section with Draw–˃Shape–˃Rectangle.
Make the following changes for the rectangle through property gird as shown in Figure 4.1.
Change rectangle length and width to 48”
Change CG of the rectangle to (0, 0)
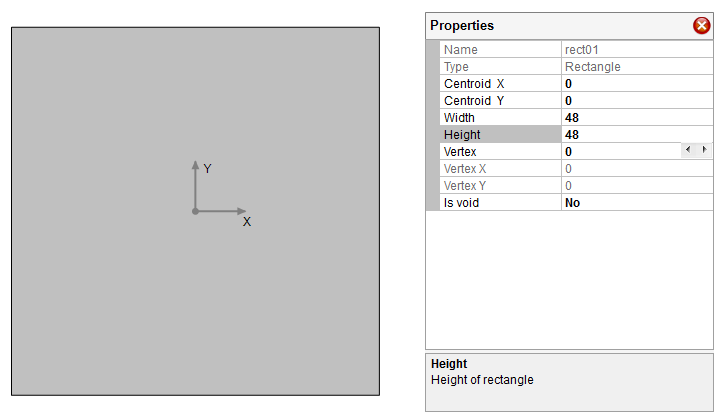
Figure 4.1 Step 1
Step 2
Draw column reinforcement with Draw–˃Reinforcement–˃Rectangular Pattern Bar. Make the following changes for the bar group through property gird as shown in Figure 4.2.
Change width and length of the bar group to 42.3”
Change CG of the bar group to (0, 0)
Change number of bars for top, bottom, left and right side to 6,6,4,4 respectively
Change bar area to 2.25
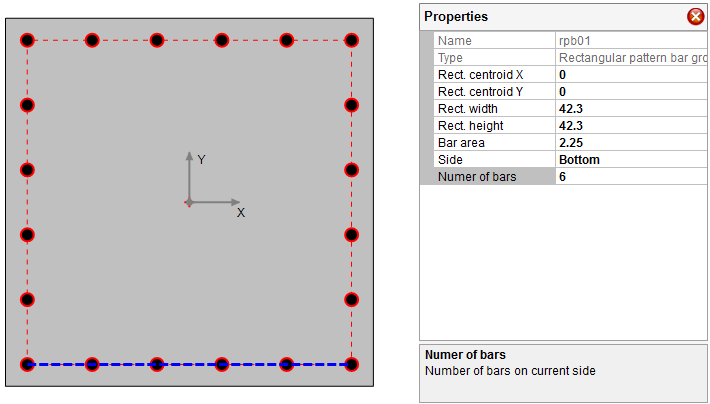
Figure 4.2 Step 2
Step 3
Select ACI318-05 design code and biaxial bending analysis type using Parameters–˃Criteria.
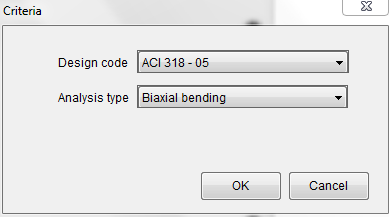
Figure 4.3 Step 3
Step 4
Input concrete compressive strength, steel strength and steel modulus of elasticity using Parameters–˃Material. For other parameters, you can use the automatically calculated values unless you are sure you want something else.
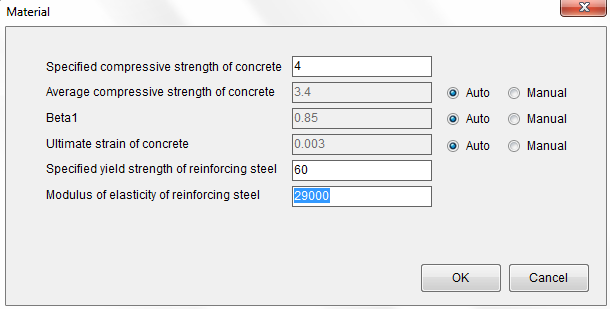
Figure 4.4 Step 4
Step 5
Select “Other” for the confinement type using Parameters–˃Resistance Factors
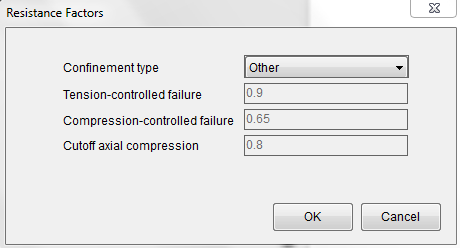
Figure 4.5 Step 5
Step 6
Switch unit system to Kip, ft. Input design loads using Parameters–˃Loads
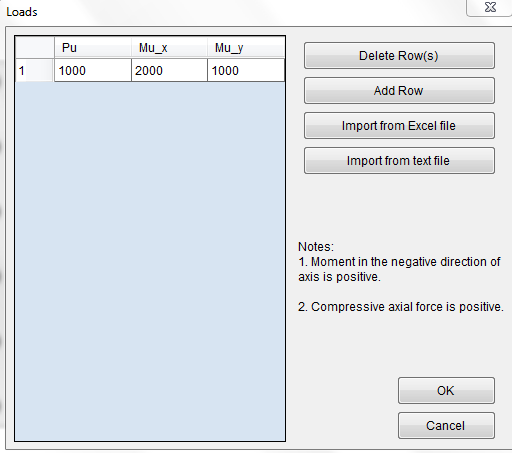
Figure 4.6 Step 6
Step 7
Switch unit system back to Kip, in.
Now it is ready to run the analysis using Analysis–˃Run.
After analysis runs successfully, the output window will become active automatically as shown in Figure 4.7. By default, the interaction diagram shown is Mx – My interaction diagram with zero axial force. The 2.119 C/D ratio means the column is able to resist the load.
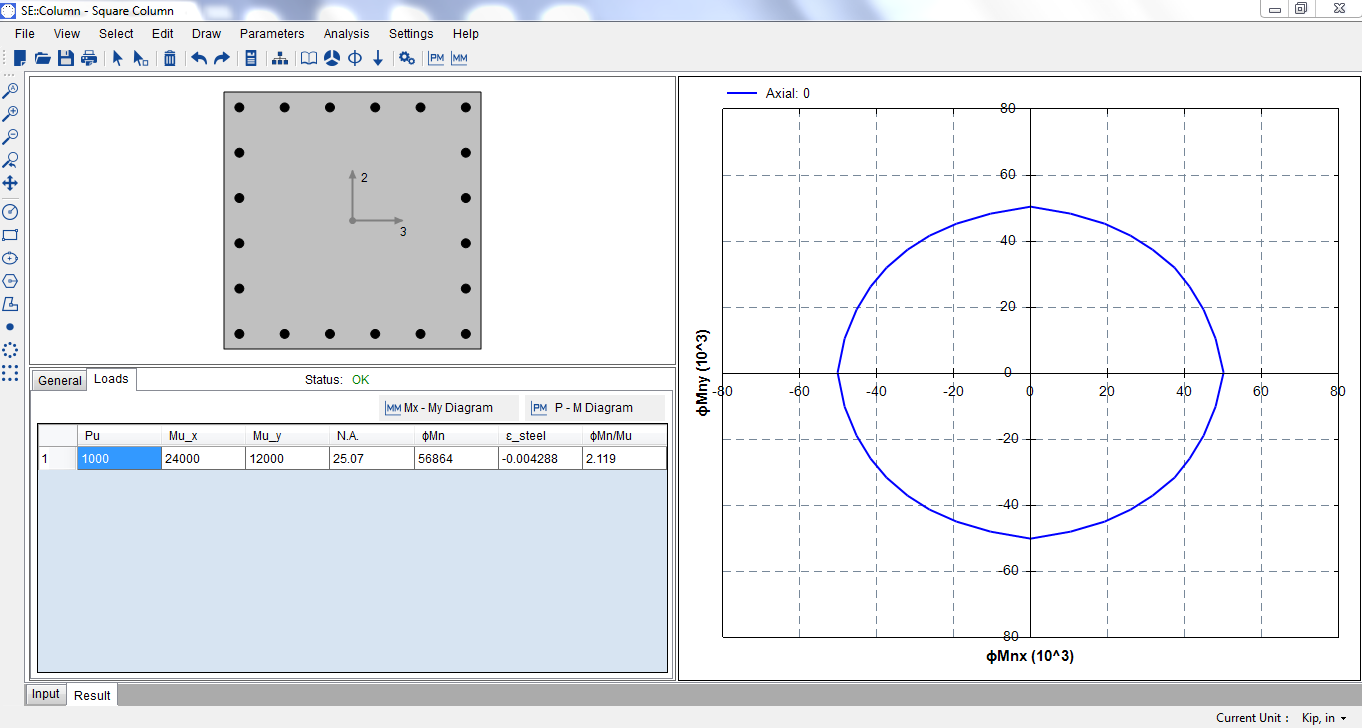
Figure 4.7 Output Window
Step 8
Select row 1 in the load table and click on My – My Diagram button. The interaction diagram will change to P=1000kips case as shown in Figure 4.8.
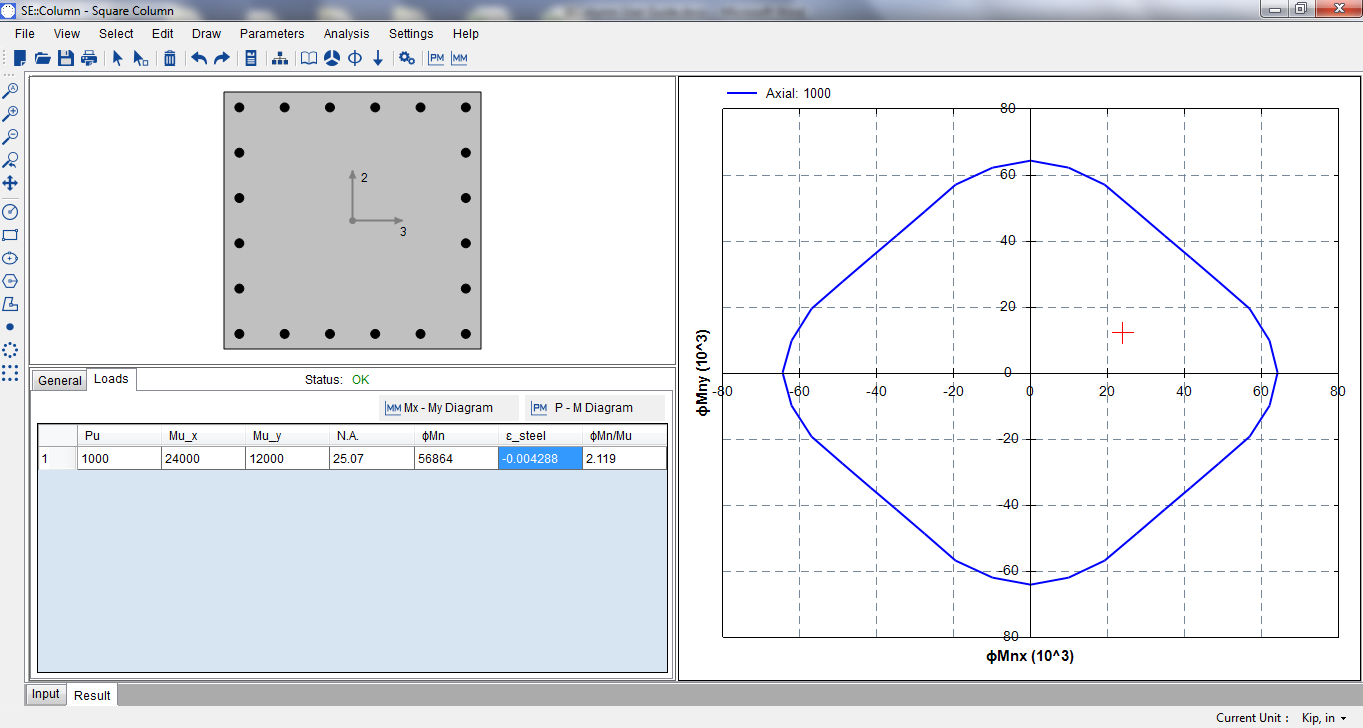
Figure 4.8 Mx – My Interaction Diagram